Reports
Introduction
There are several financial and technical reports available in energyPRO. The actual available reports are depending on which energyPRO module, that is selected, the types of energy demands in the project and the selected operation strategy.
The reports are context sensitive, which primarily means that irrelevant information is excluded. For instance information about thermal stores are not shown if there are no thermal stores in the project and the report “Duration curve for cooling demand” is not available if no cooling demand is present.
The available reports in energyPRO with the ACCOUNTS module chosen are shown below.

* Reports are available in FINANCE and ACCOUNTS
** Reports are available in ACCOUNTS only.
*** Operation Strategy Calculation is available only if the operation strategy selected as auto calculated in “Operation strategy”.
**** Compare reports are available only when having a COMPARE license.
Hereto come that the duration curves are only shown if the specific demand type is present in the project
Report Header information
Common for all the reports are the report header. The information found in these headers is shown below. The following numbers are referring to the figure.
- The name of your project file (extension excluded)
- Project Information given in the Project Identification editing window
- The name of the report
- Date and time for report generation
- Your registration information
- Your company logo, if chosen as described in section Reference, Menu Bar, Options

Reports to Clipboard
All the reports can be copied to clipboard as graphic by clicking a button that copies the report to the clipboard. Most of the reports also have a data export button. If this button is selected the data is copied to the clipboard ready for copying into a spread sheet for instance Excel.

Production, Graphical
The graphs included in this report depend on the content of your project. The graphs are as follows:
- External conditions
- Priorities of the individual production units
- Heat production (if Heat production)
- Electricity Production (if Electricity production)
- Cooling Production (if cooling production)
- Fuels
- Thermal storage (if a Thermal storage is used)
- Fuel storage (if fuel storage is used)
- Battery energy (if electricity storage is present)
- Battery Storage (if electricity storage is present)
The report below shows the production of a site with various energy conversion units for in a week in January.
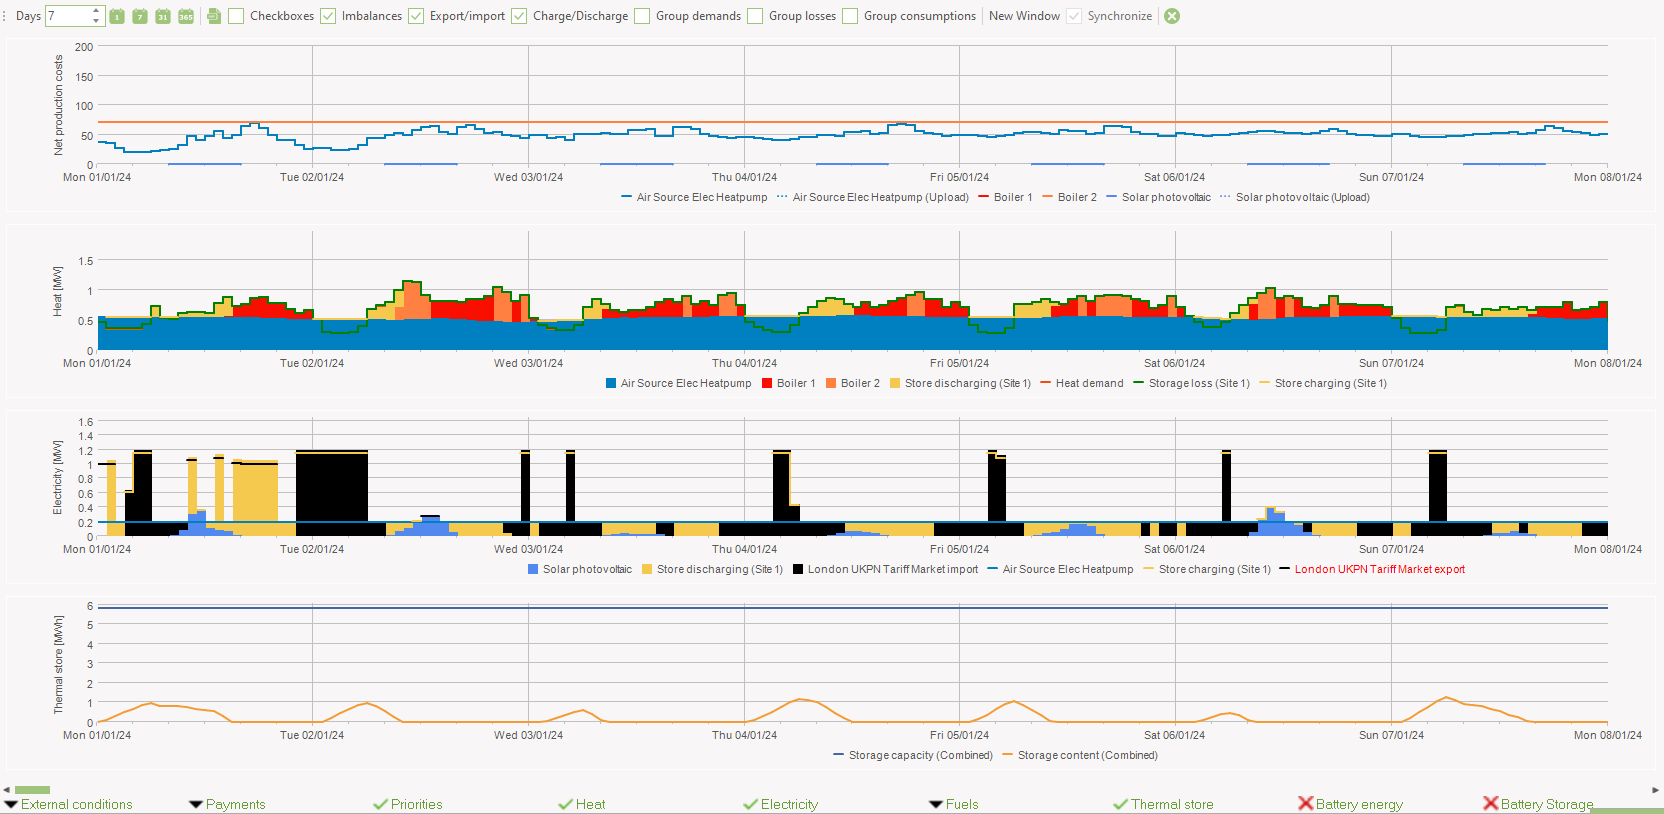
This report shows four graphs. At top you see the net production costs for each production unit. The second graph shows the heat demand and production, the electricity demand and production is shown in the third graph and the last graph shows the storage content.
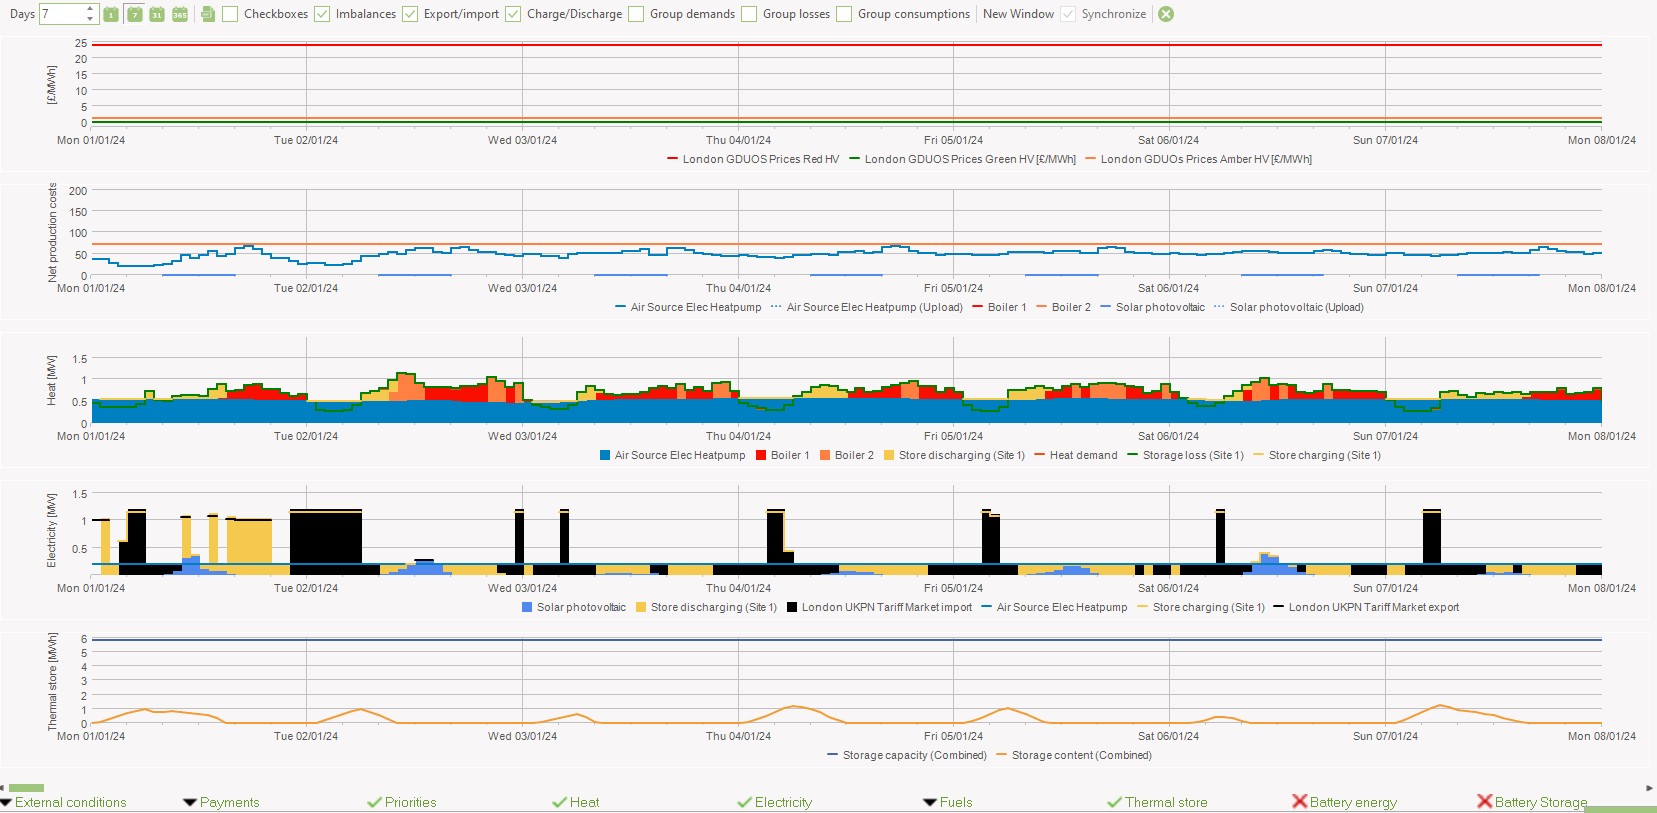
You have the option of showing time series and time series functions as well as payments by pressing either the "External conditions" button or the "Payments" button at the menu bar at the bottom.
This is illustrated in the report below, where three energy price conditions are shown as well as the previously included graphs.
Production, carpets
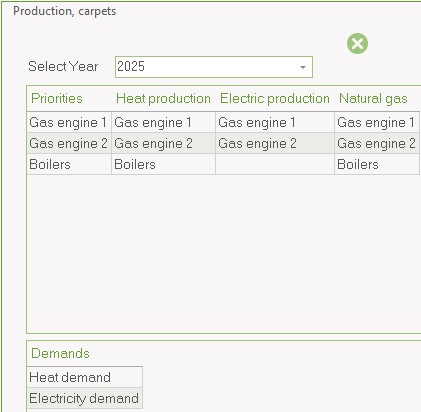
When selecting the report “Production , carpets” a selection window appear.
- Select Site. Select a specific site or combined (REGION only)
- Select Year. The year you want to see the carpet view for.
- Select Item. Click the item in one of the tables. E.g. Boiler in the heat production column.
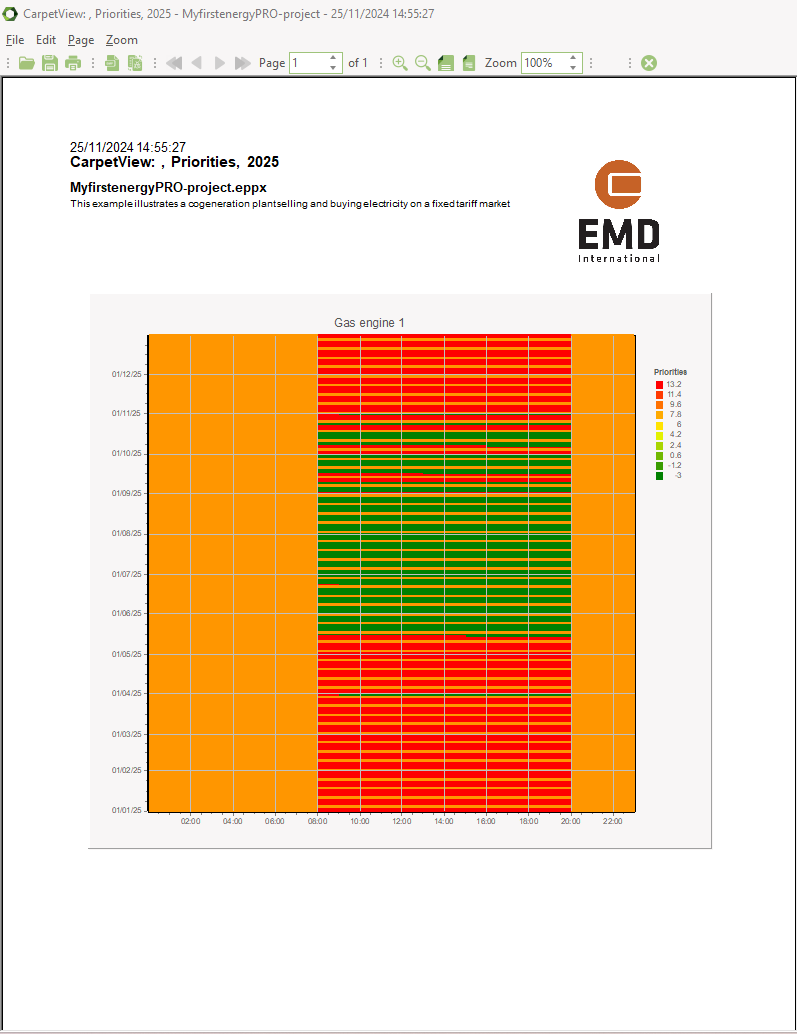
When the Item is clicked in the table the corresponding carpet view will appear as seen below.
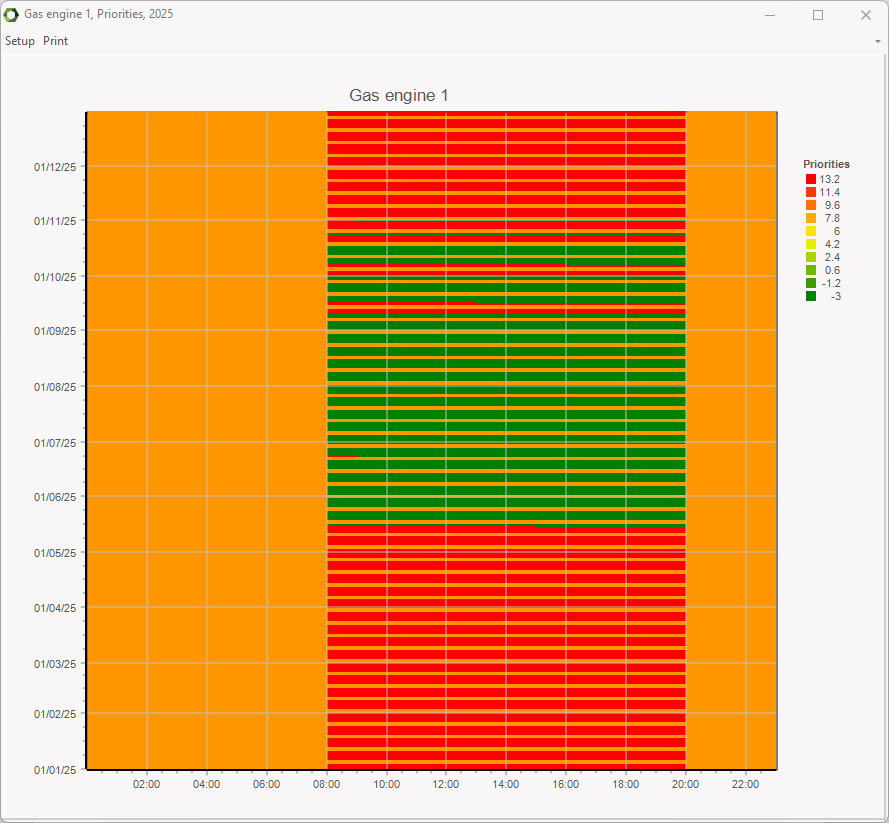
This view has a setup option and a print option. Selecting the setup option you have access to some basic design options for the view. See also Reference, External Conditions, Time Series.
At present it is NOT possible to include this report in project reports.
Transmission, graphic
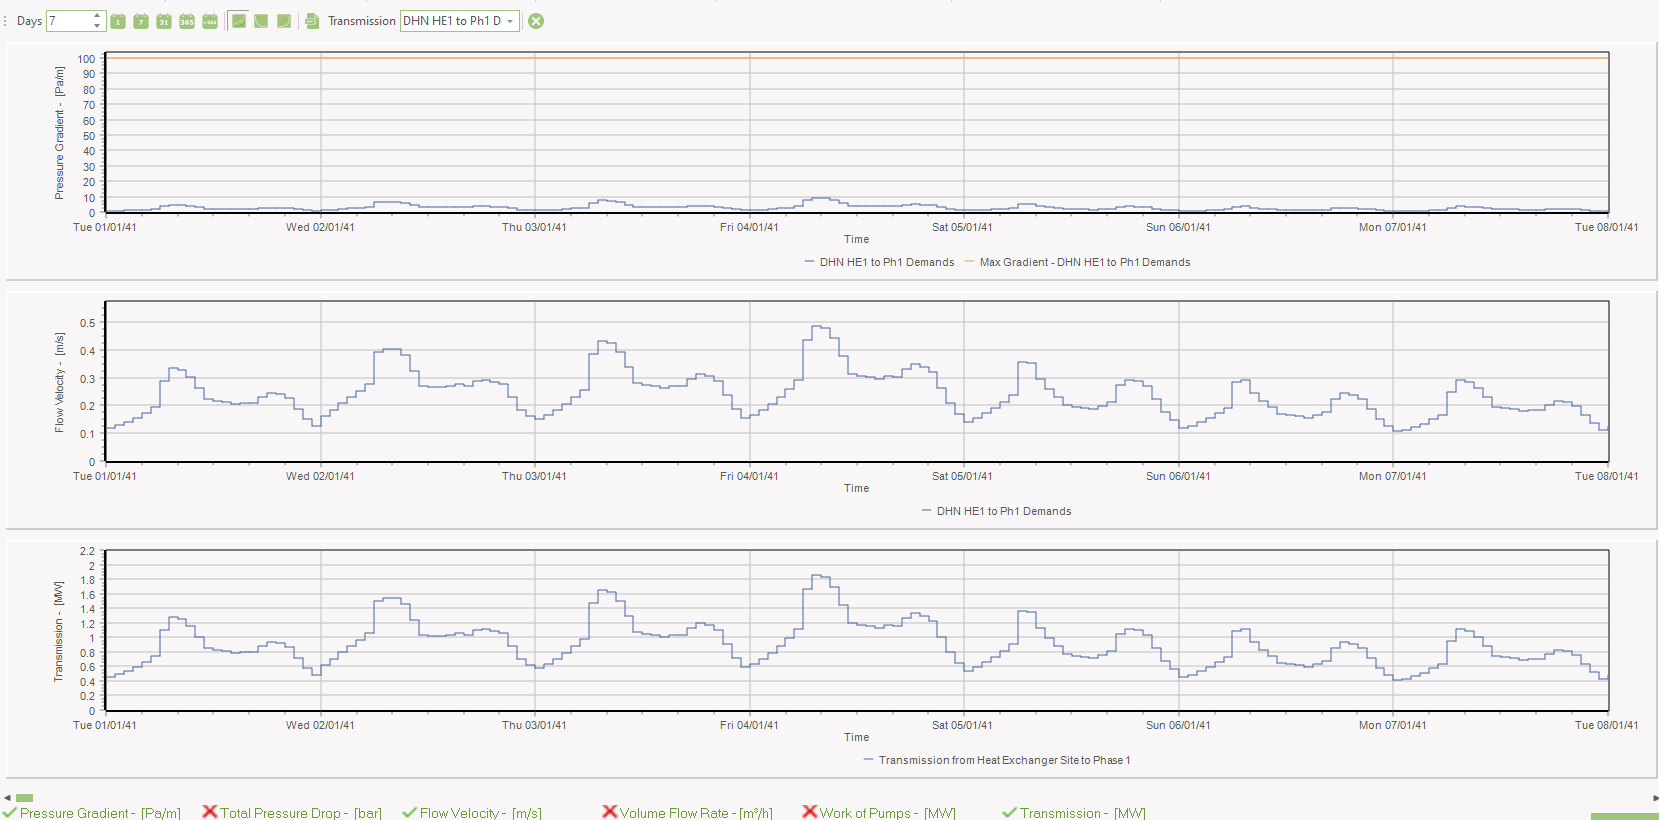
In "Transmission, graphic”, you can choose “Transmission” to see one of the transmission lines.
The example below shows the plots of "Pressure Gradient", "Flow Velocity" and transmitted heat as a function of time. Below the shown plots, you can select "Total Pressure Drop", "Volume Flow Rate" and "Work of Pumps".
The calculation of Pressure Gradient and Flow velocity is shown in Methods, Hydraulic Transmission.
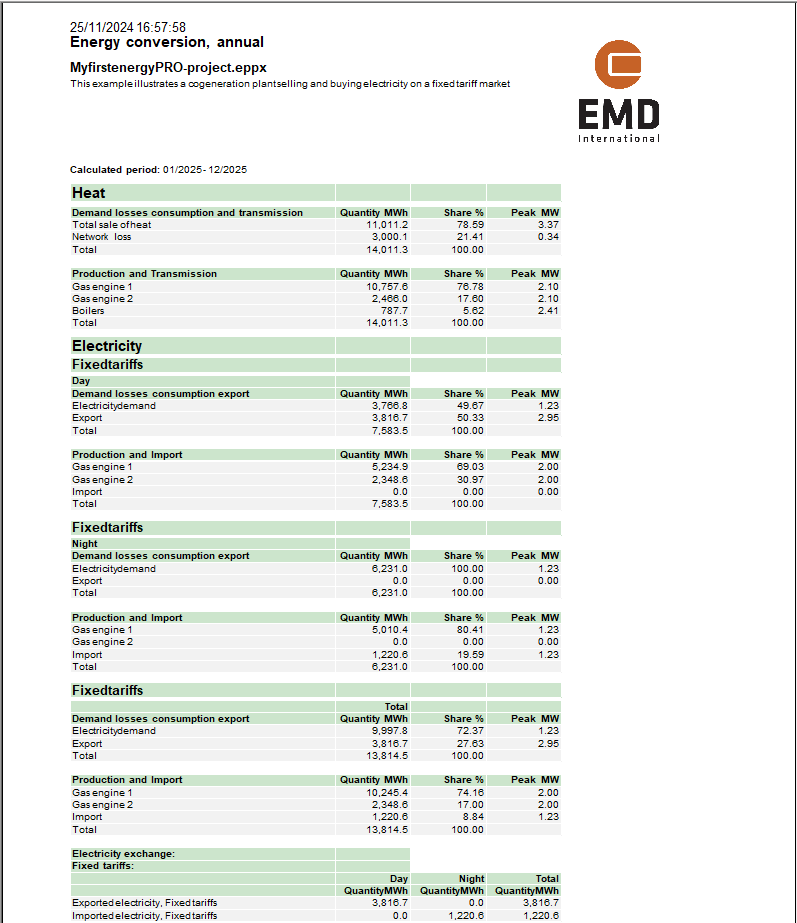
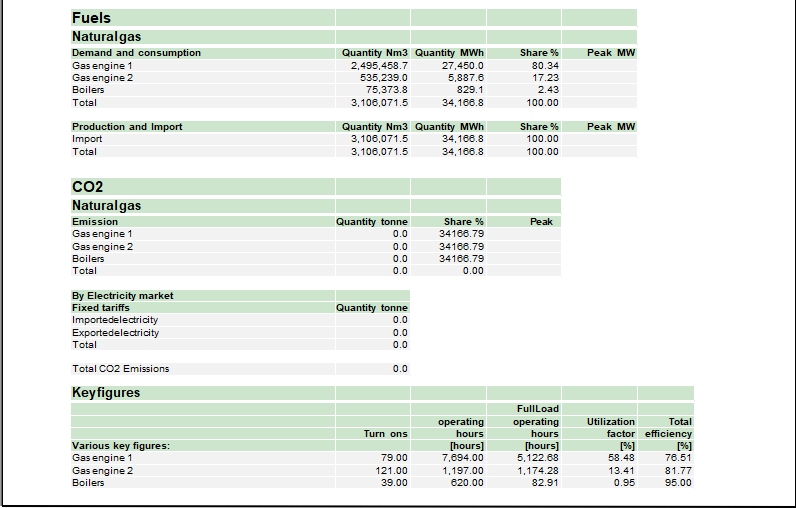
Energy conversion annual
This report shows the energy conversion on annual basis. The content of the report is:
- Demands
- Productions
- Transmissions
- Losses
- Hours of operations
- Various key figures:
- Number of Turn-ons
- Full load hours
- Utilization factor
- Total efficiency
- Fuel consumptions
If “Fixed tariffs” is defined in “Electricity markets” the electricity production will be distributed in the defined tariff periods.
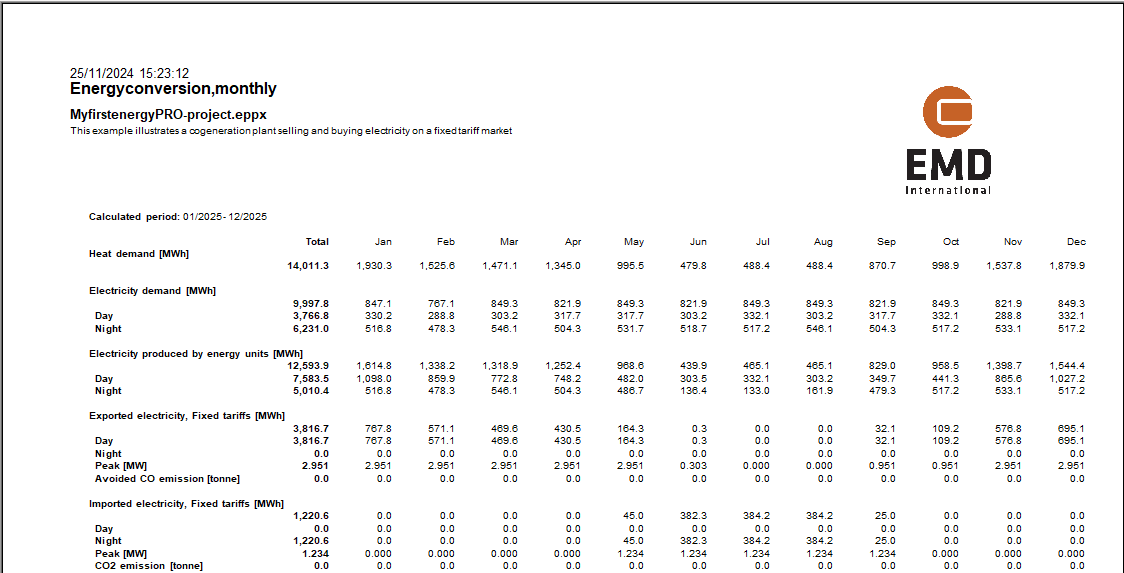
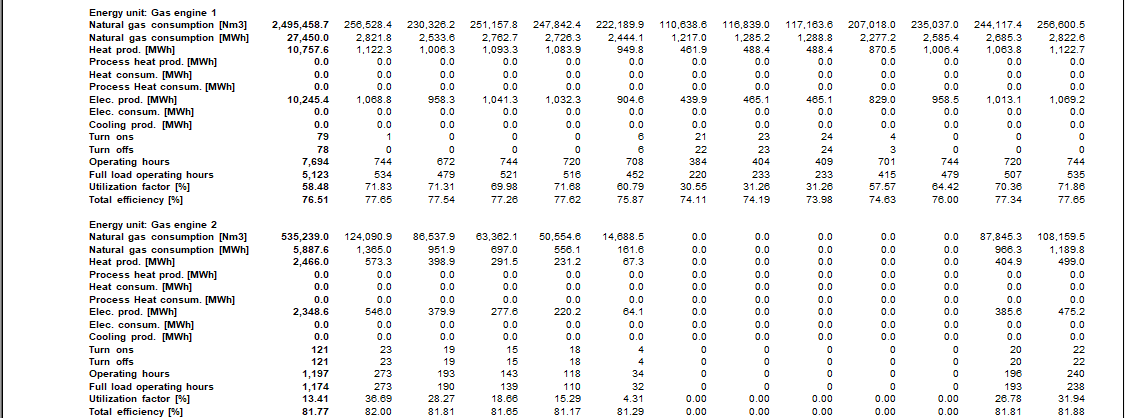
Energy Conversion, monthly
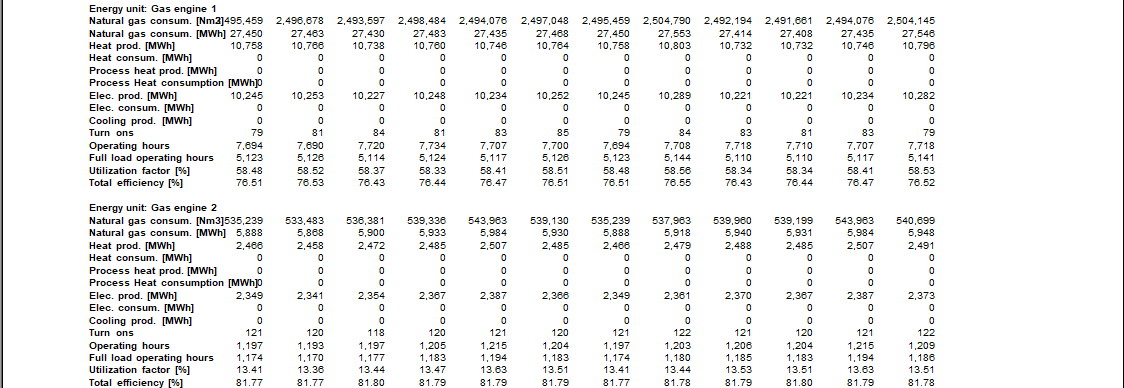
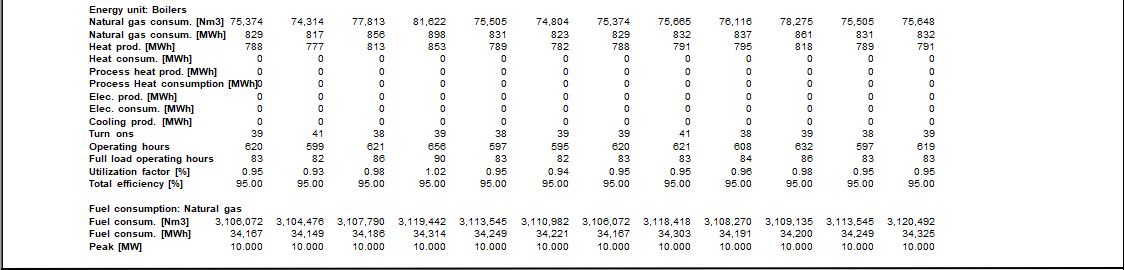
This report includes the same information as the “Energy conversion, annual” report, although the structure is a bit different and it includes monthly values for the energy conversion. Where the annual report is organized by demands and productions this report is on the other hand structured by Production units and fuels.
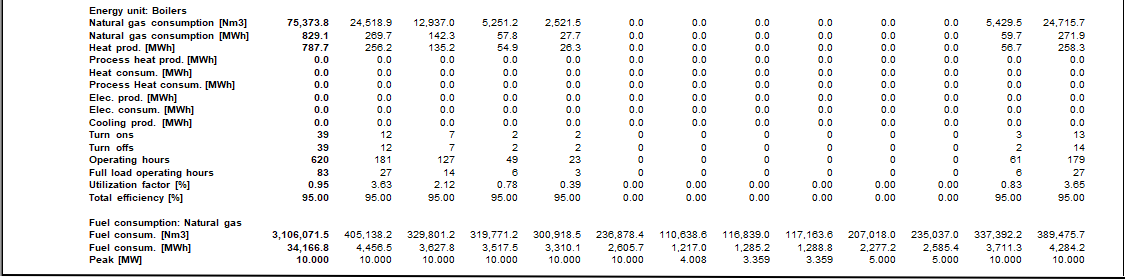
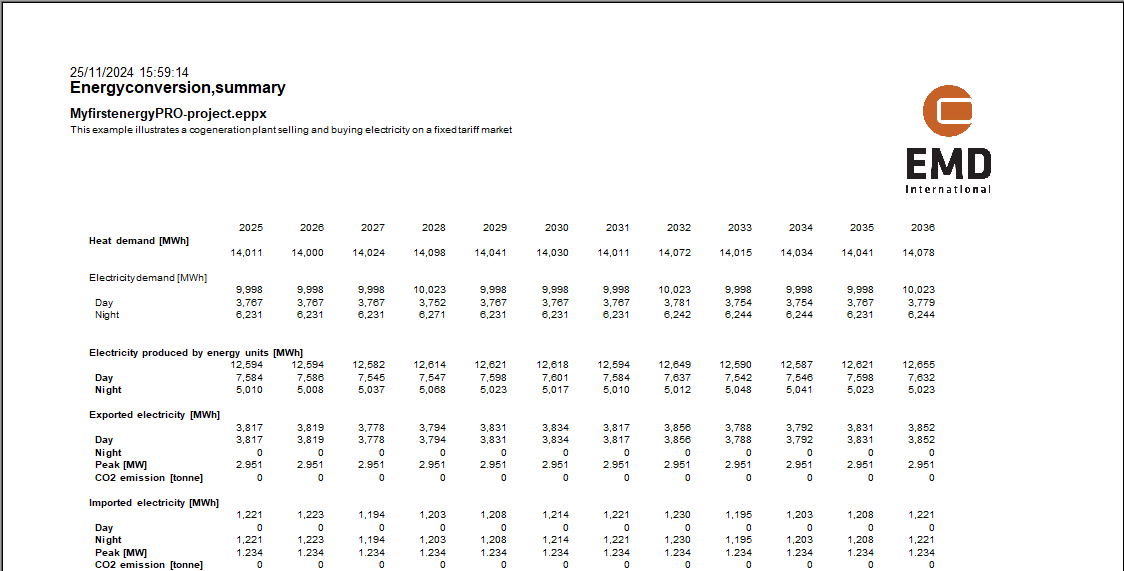
Energy Conversion, summary
This report is available if the FINANCE or the ACCOUNT module is chosen. This report is structured as the “Energy conversion, monthly” report except that the values in this report is shown annually.
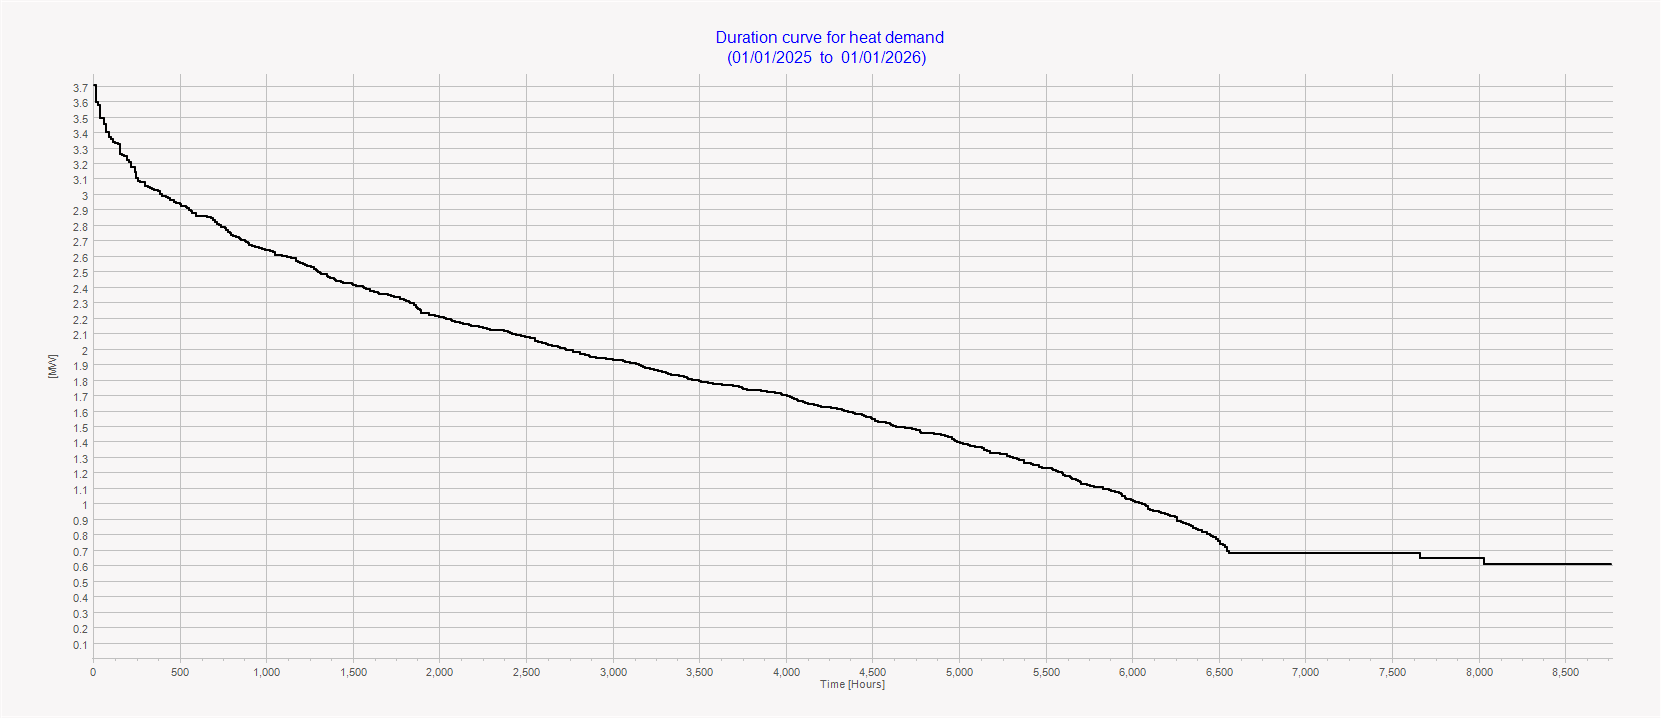
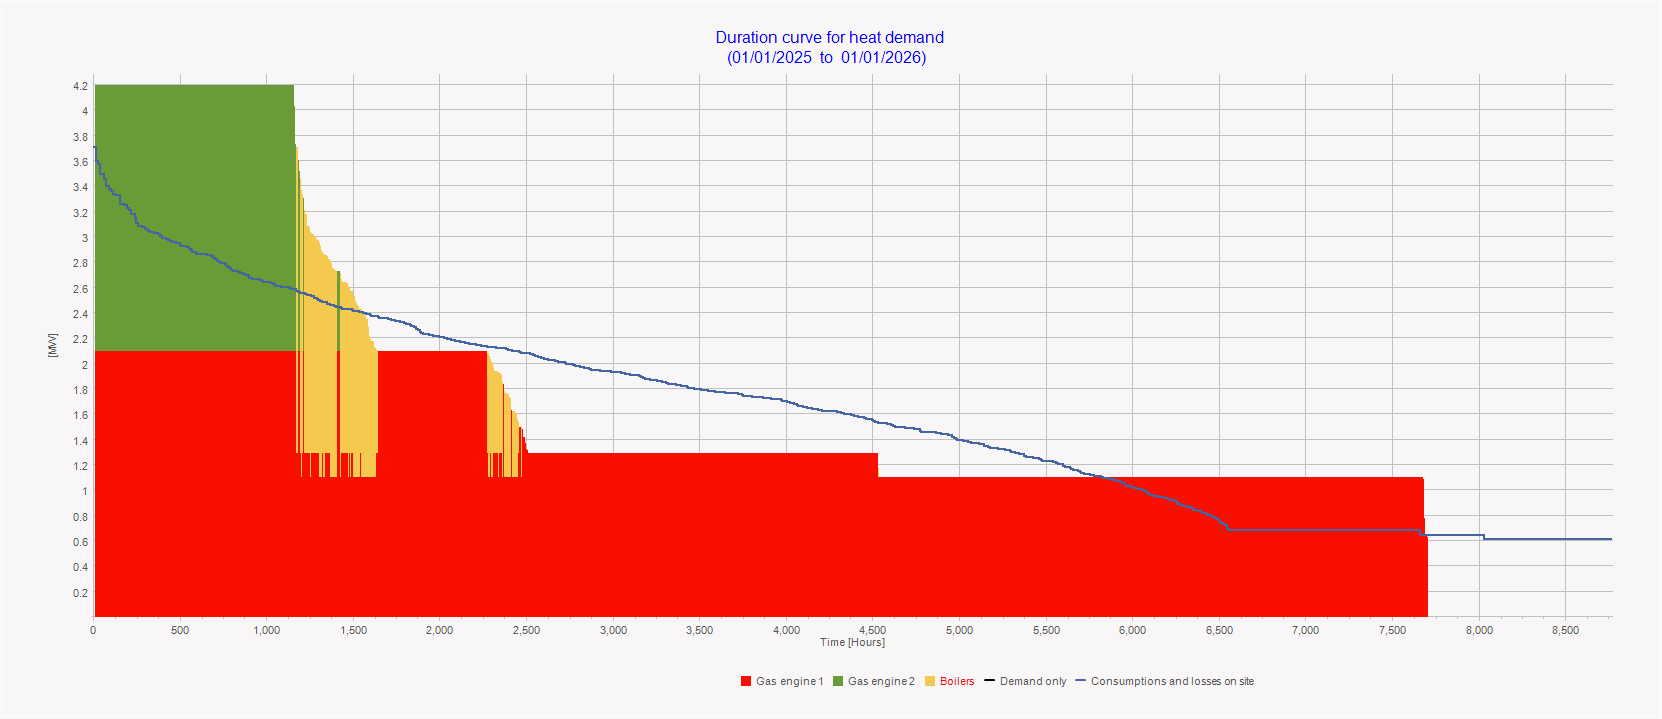
Duration curves for Demands
There are demand curves available for the types of demand defined in the project.
Below is show an example of a duration curve for heat demand. Firstly, the duration curve is shown. Secondly the productions are shown. The watchful observer will notice that the productions do not hour by hour match the demands. The reason is that a thermal store is displacing productions in order to operate the plant more efficiently.
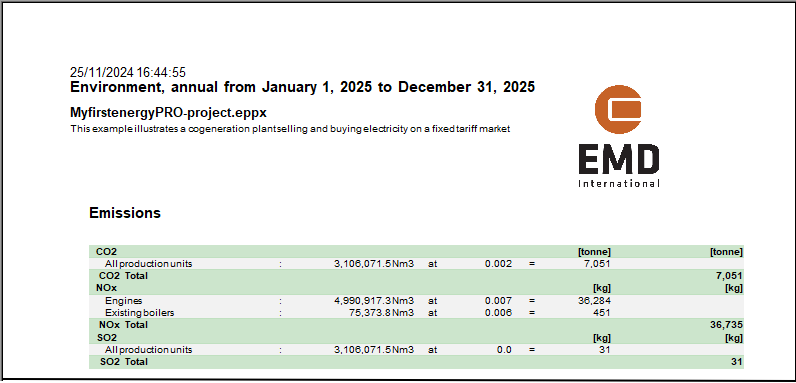
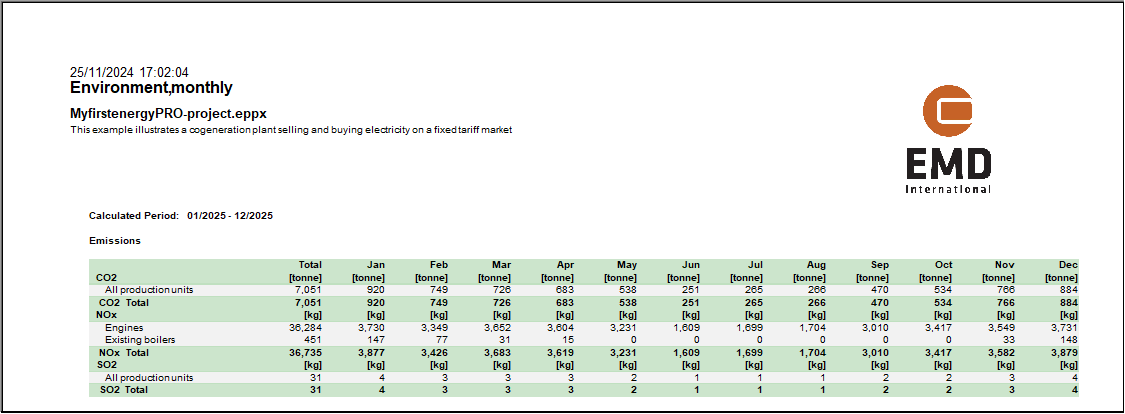
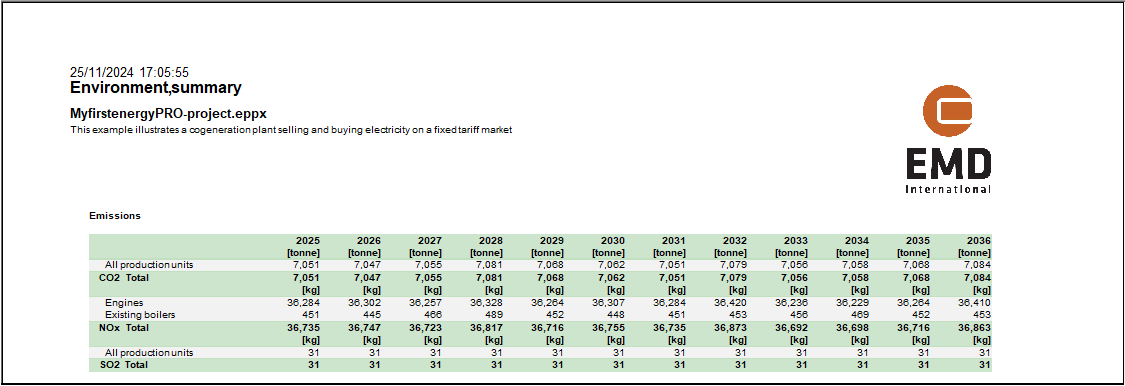
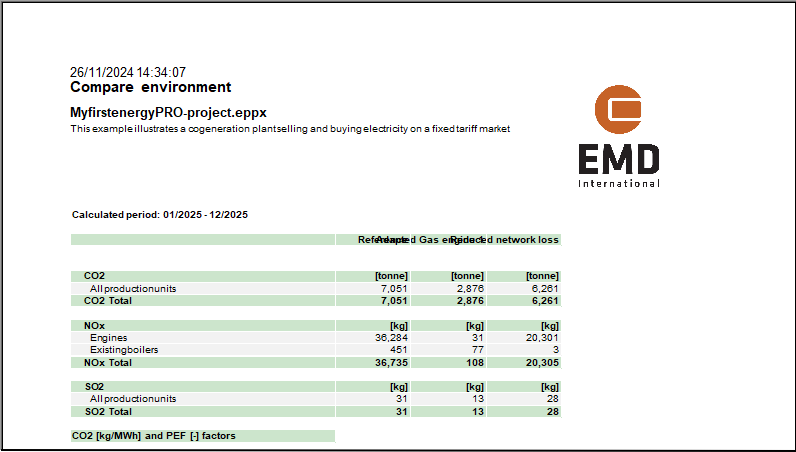
Environment
The "Environment" reports are based on the information you defined in your environment input data folder. This can be provided as an annual, monthly or summary report as shown below in that order.
Economy Reports introduction
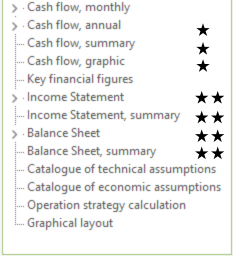
The available reports are module-dependent. As shown below there are two reports concerning economy available in all modules, “Cash flow, Monthly”, and “Catalogue of economical assumptions”. If the FINANCE-module is chosen additional three reports are optional. This is “Cash flow, summary”, “Cash flow, Graphical” and “Key financial figures”. Finally, further four reports are optional if the ACCOUNTS-module is chosen. This is “Income Statement”, “Income Statement, summary”, “Balance Sheet” and “Balance Sheet, summary”.
When previewing the economy reports you have some setup options:
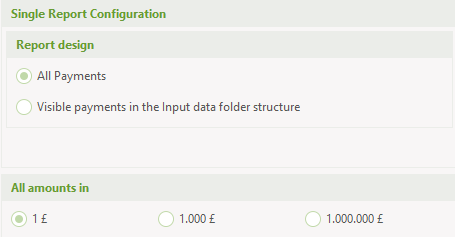
The first option is to state if you will see all the payments, you defined in your economy input data folders or only those visible in the input data folder structure. The second option is to set up the amount used in the reports.
If the “Visible payments in the input data folder structure” is marked, the report will be different.
The project economy is the same but the report will be more aggregated for instance having only one line for “sale of electricity”, while for example with all payments selected the electricity sale in day and night tariffs may be visible.
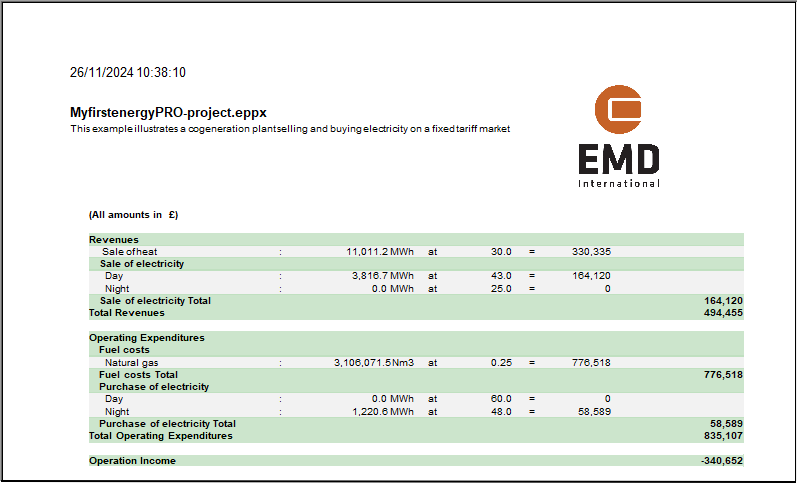
Operation income
This report is available in DESIGN only. It includes all operational payments, i.e. revenues and operating expenditures.
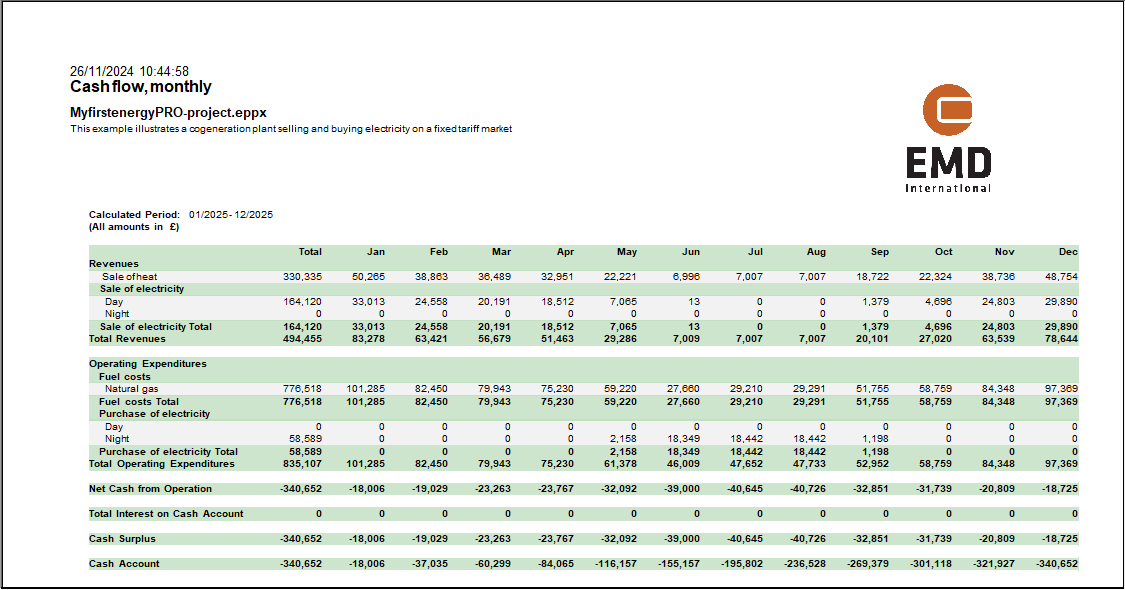
Cash flow, monthly
The "Cash flow, monthly" report includes all payments in a project in the month that the payments take place. The payments include:
- Operational payments
- Revenues
- Operating expenditures
- Investments
- Financial payments
- Eventually tax payments
- Interest on cash account
Cash flow summary
The "Cash flow, summary" report includes all payments in a project in the year that the payments take place as with the cash flow, monthly report. The only difference is that the columns are annual numbers instead of monthly.
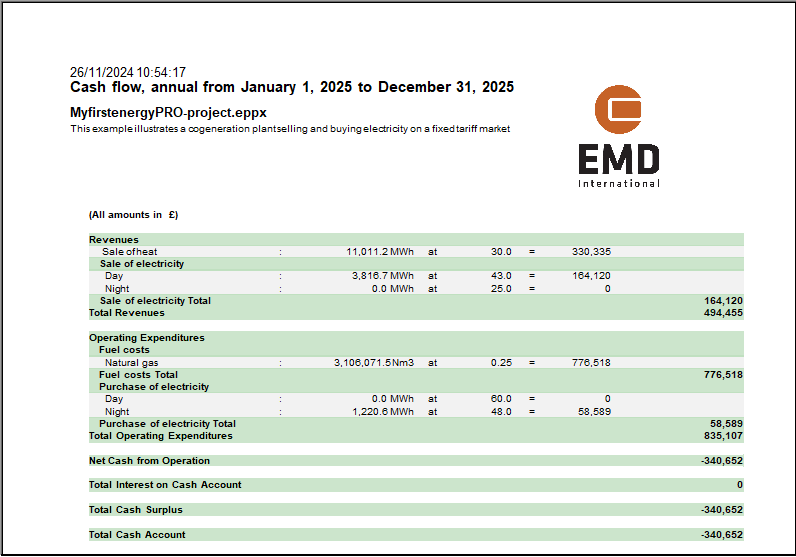
Cash flow annual
This report is only available in FINANCE and ACCOUNTS. Similar to Operation income in DESIGN and Income statement in ACCOUNTS, the Cash flow, annual report shows the amount and price per unit as well as income or expenditure of the payment.
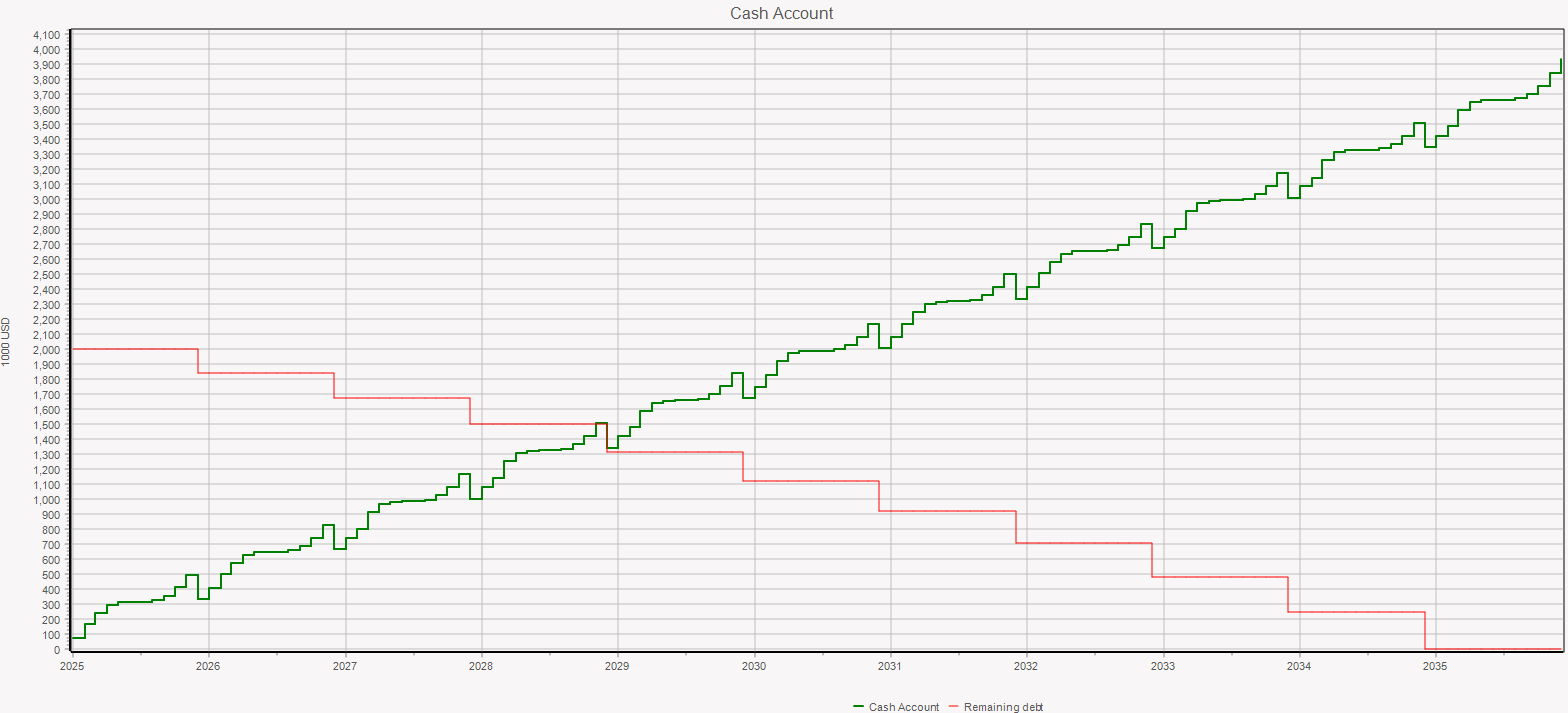
Cash flow, graphical
This report is invoked by pressing the "Cash flow, graphic" button.
This report shows the development in the cash flow shown graphically. In the example shown below shows that the cash account exceeds the debt late 2028 and the debt is payed in 10 years. The downward line represents the remaining debt and the upward line shows the cash account
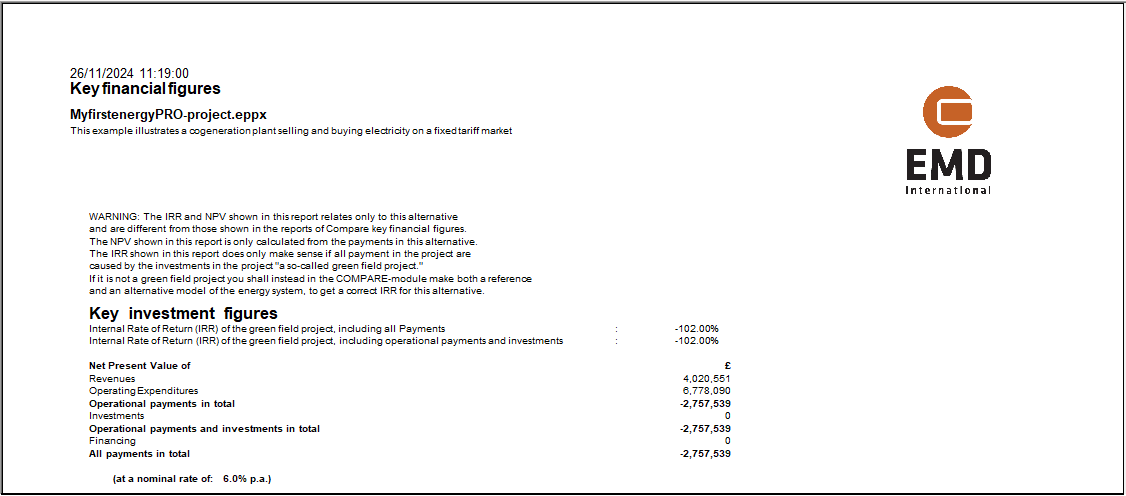
Financial key figures
This report states the key financial figures used, as shown below.
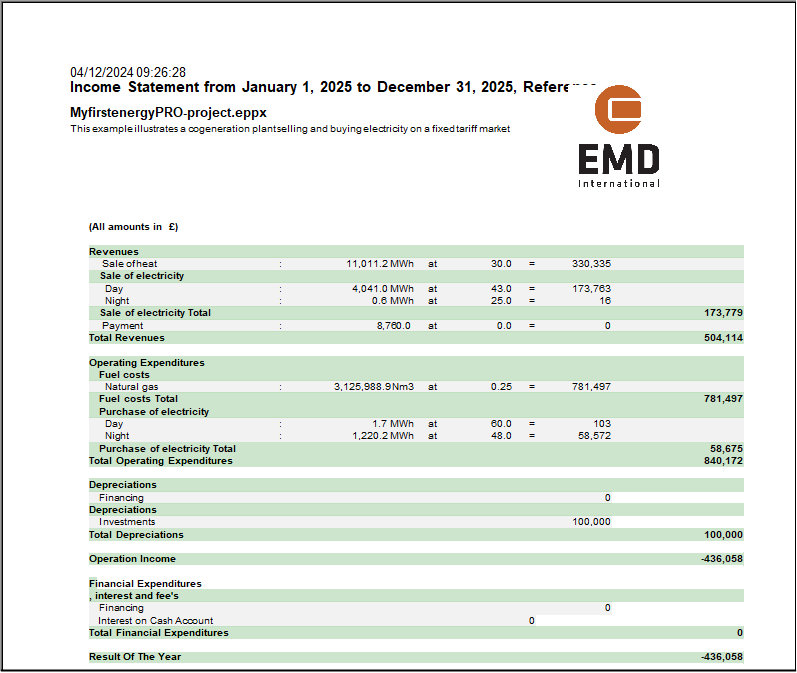
Income statement
The "Income statement" report for the energy company shows the result of the year for the company after depreciations and taxations.
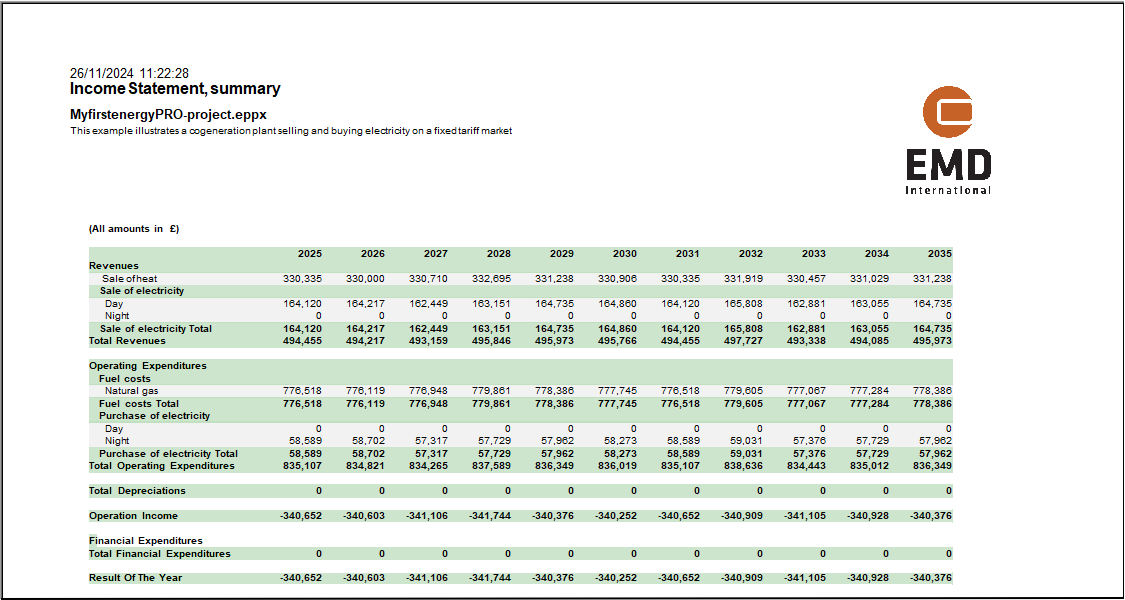
Income Statement, summary
The "Income statement, summary" report includes the balance sheet for all years in the planning period.
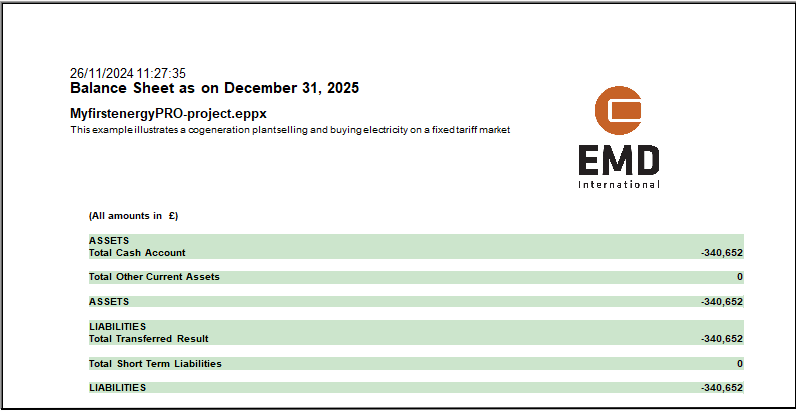
Balance sheet
The last financial report is the "Balance sheet".
Balance sheet, summary
The "Balance sheet, summary" report includes the balance sheet for all years in the planning period.
Catalogue of technical assumptions
This catalogue includes most of the technical data in the technical input data folders. The exception is that the time series are only represented by monthly min/max and average values. The structure of the catalogue follows the input data folder structure.
Catalogue of economic assumptions
This catalogue includes most of the financial data in the economy input data folders. The structure of the catalogue follows the input data folder structure. Formulas used for defining payments are placed in an appendix in the catalogue.
Operation Strategy Calculation
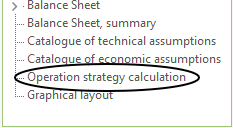
This report shows the calculation of the operation strategy in details. The report is invoked by clicking "Operations strategy calculation" in the "Project report" window, shown below.
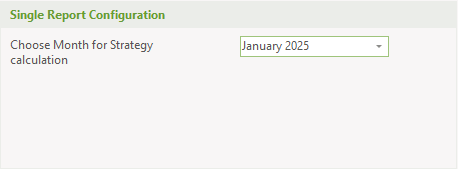
In the preview, choose the month to be shown.
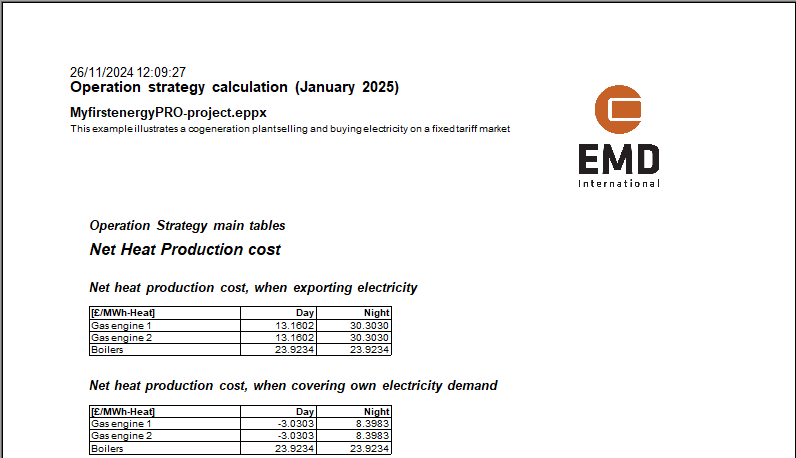
Hereafter a report will appear. The report layout is depending on the selected operation strategy.
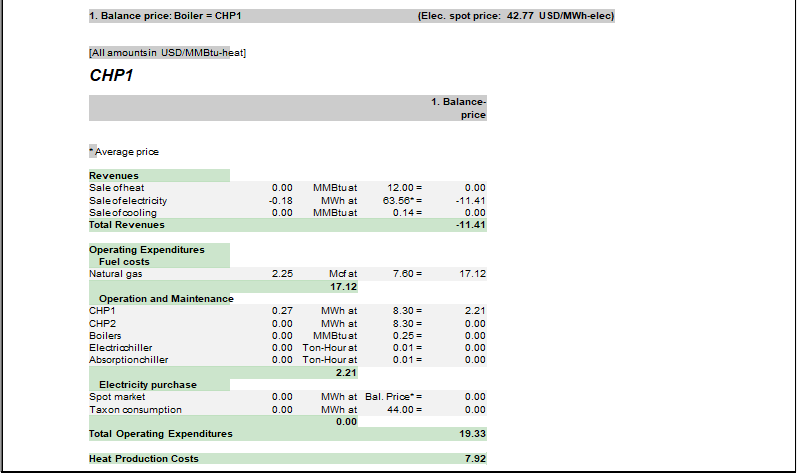
Fixed tariffs
The report starts with a main table containing the calculated Operation Strategy. The value in this table is identical with the values found in the “Operation Strategy” editing window.
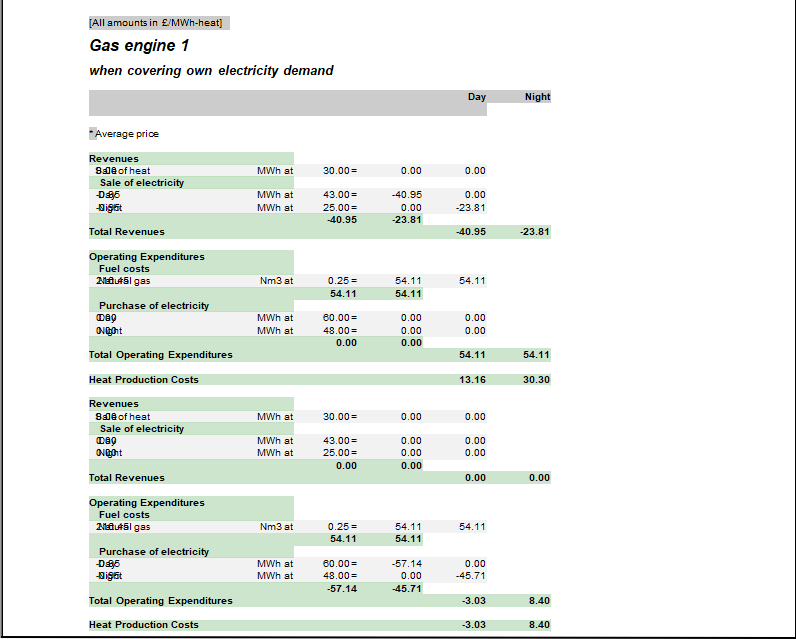
Hereafter follows tables with detailed calculation results for each production unit. Each table contain the calculation of the net heat production costs in all tariff periods.
Note that payments that are identical for all production units in all tariff periods are excluded. This could for instance be a fixed payment not related to the energy conversion.
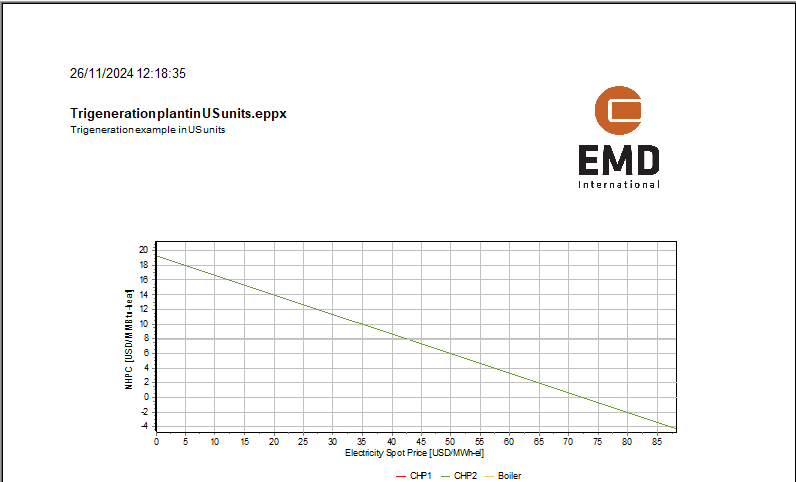
Spot prices
The first page contains the graphic representation of the net heat production costs as function of the electricity spot prices.
Hereafter follows one page per energy unit, where the net heat production costs are calculated for all production units.
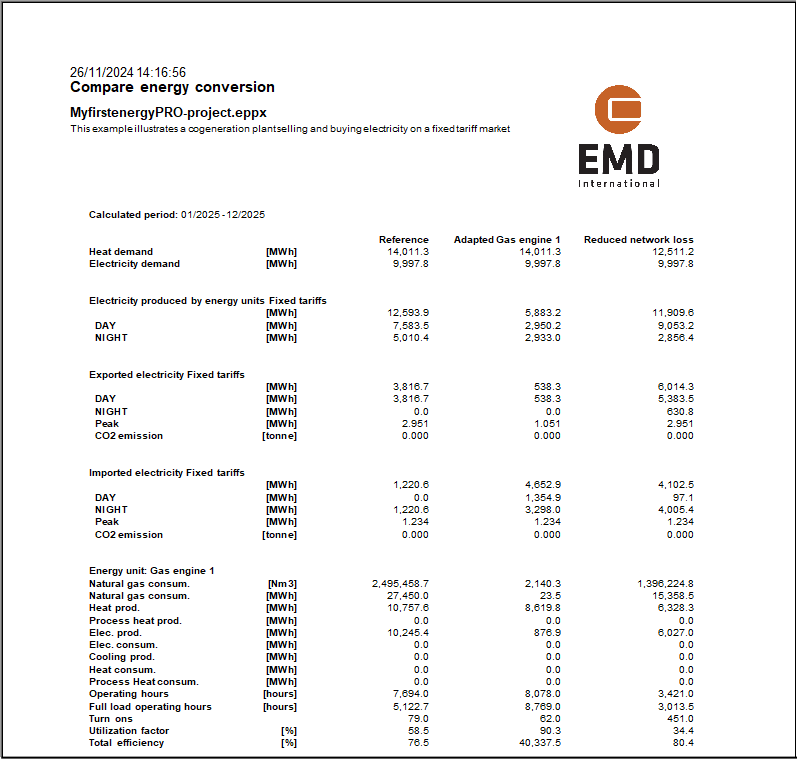
Compare energy conversion
The "Compare energy conversion" report is available when having a COMPARE license and your project contains one or more alternatives.
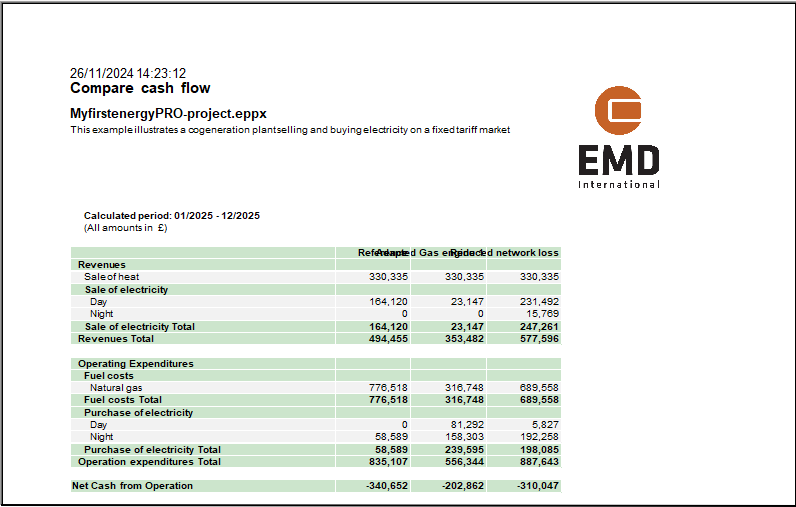
Compare cash flow
The "Compare cash flow" report is available when having a COMPARE license and your project contains one or more alternatives.
Compare Income statement
The "Compare income statement" report is available when having a COMPARE license and your project contains one or more alternatives. Further, you need to be in ACCOUNTS.
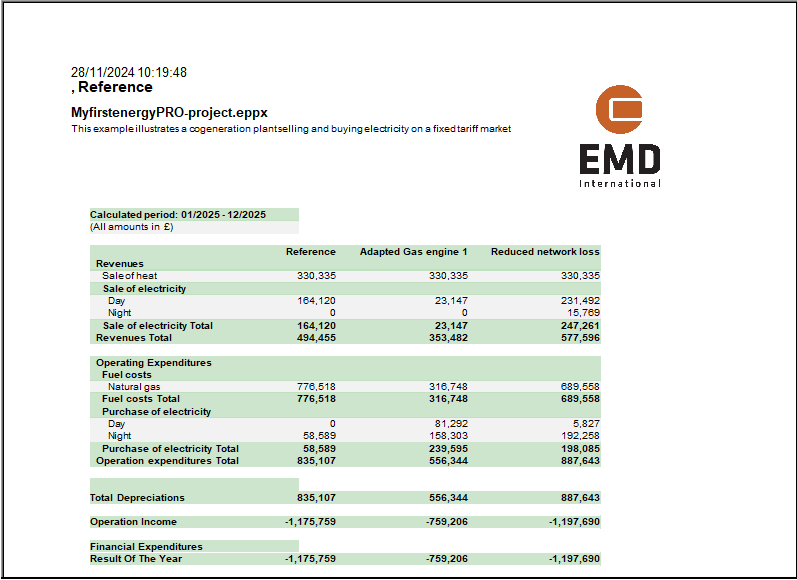
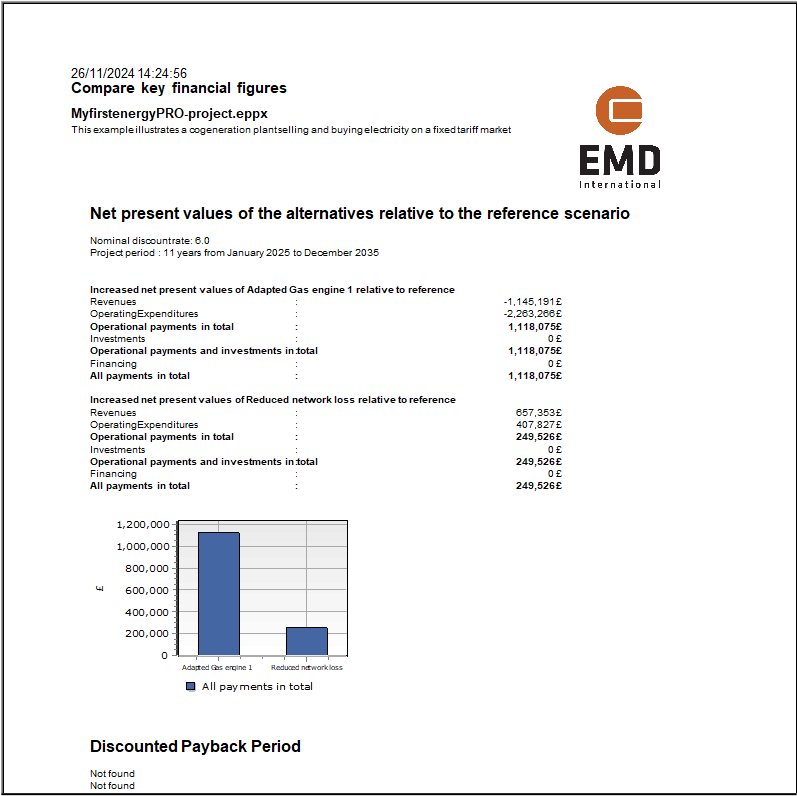
Compare key financial figures
The "Compare key financial figures" statement report is available when having a COMPARE license and your project contains one or more alternatives. Further, you need to be in FINANCE or ACCOUNTS. The key financial figures for the alternatives are relative to the reference scenario.
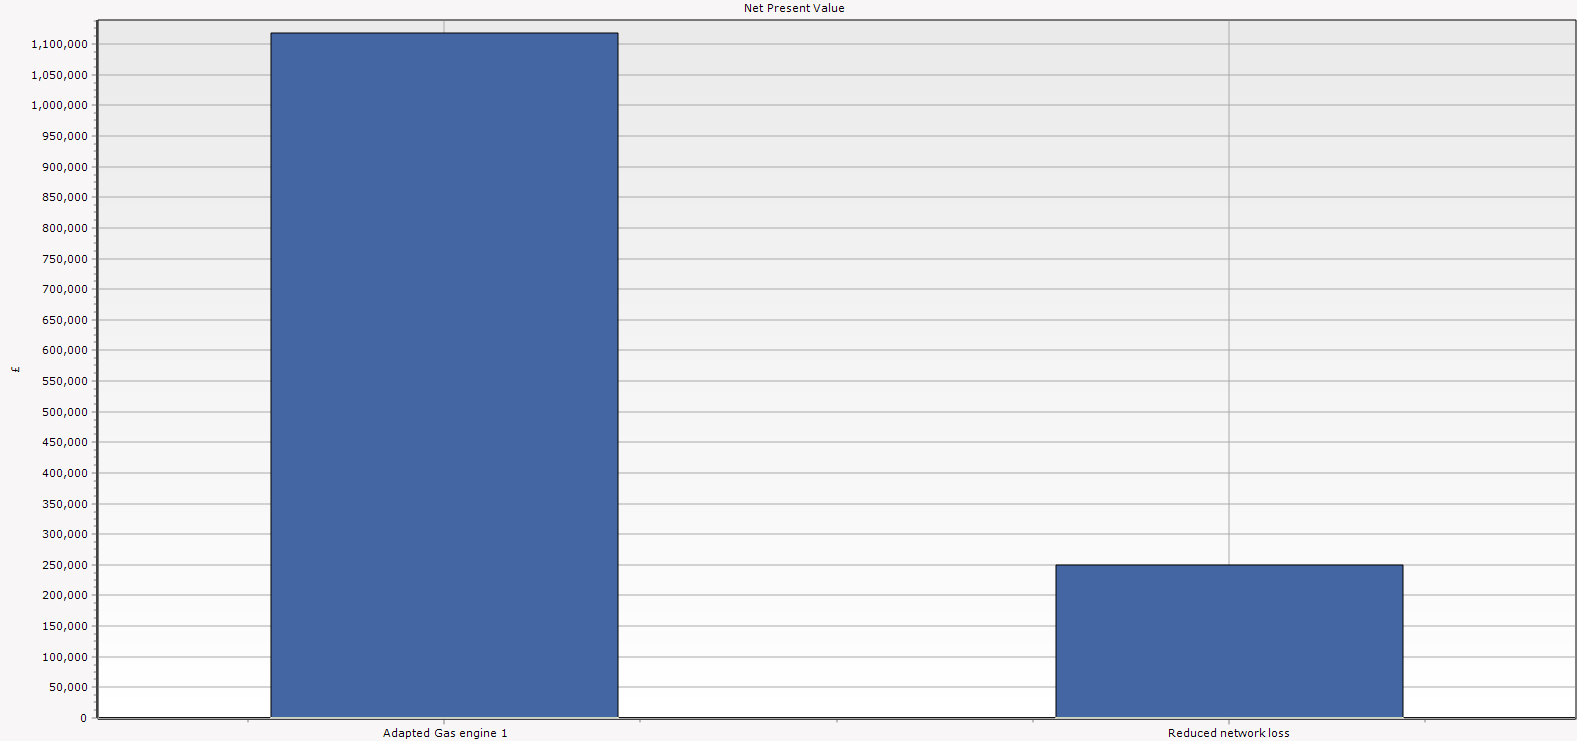
Net Present Value, graphic
As appendix to the "Compare key financial figures", the "Net Present Value" can be seen as a chart of its own.
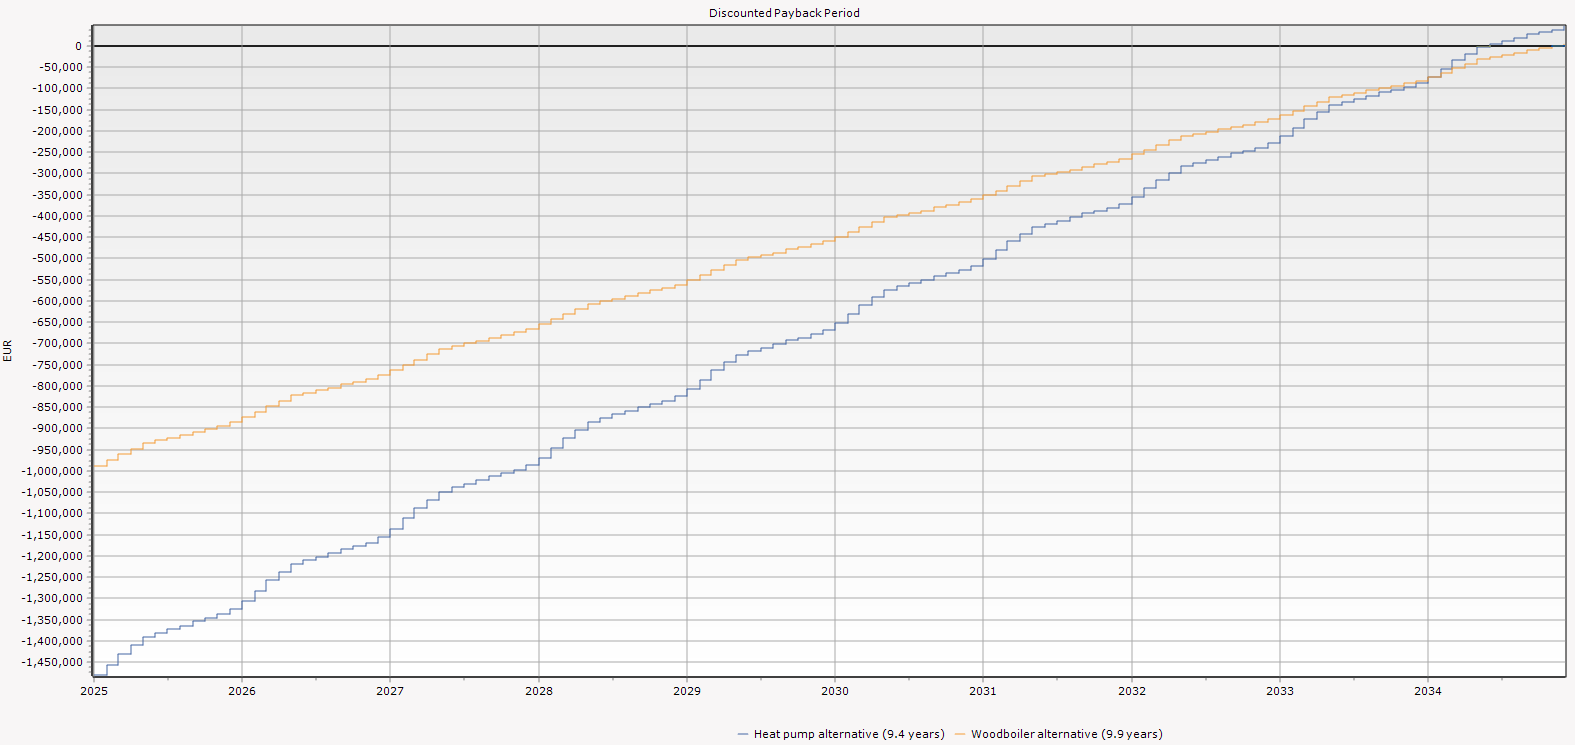
Discounted Payback Period, graphic
Similar to the "Net Present Value, graphic" report, the "Discounted Payback Period, graphic" can be shown as a report of its own.
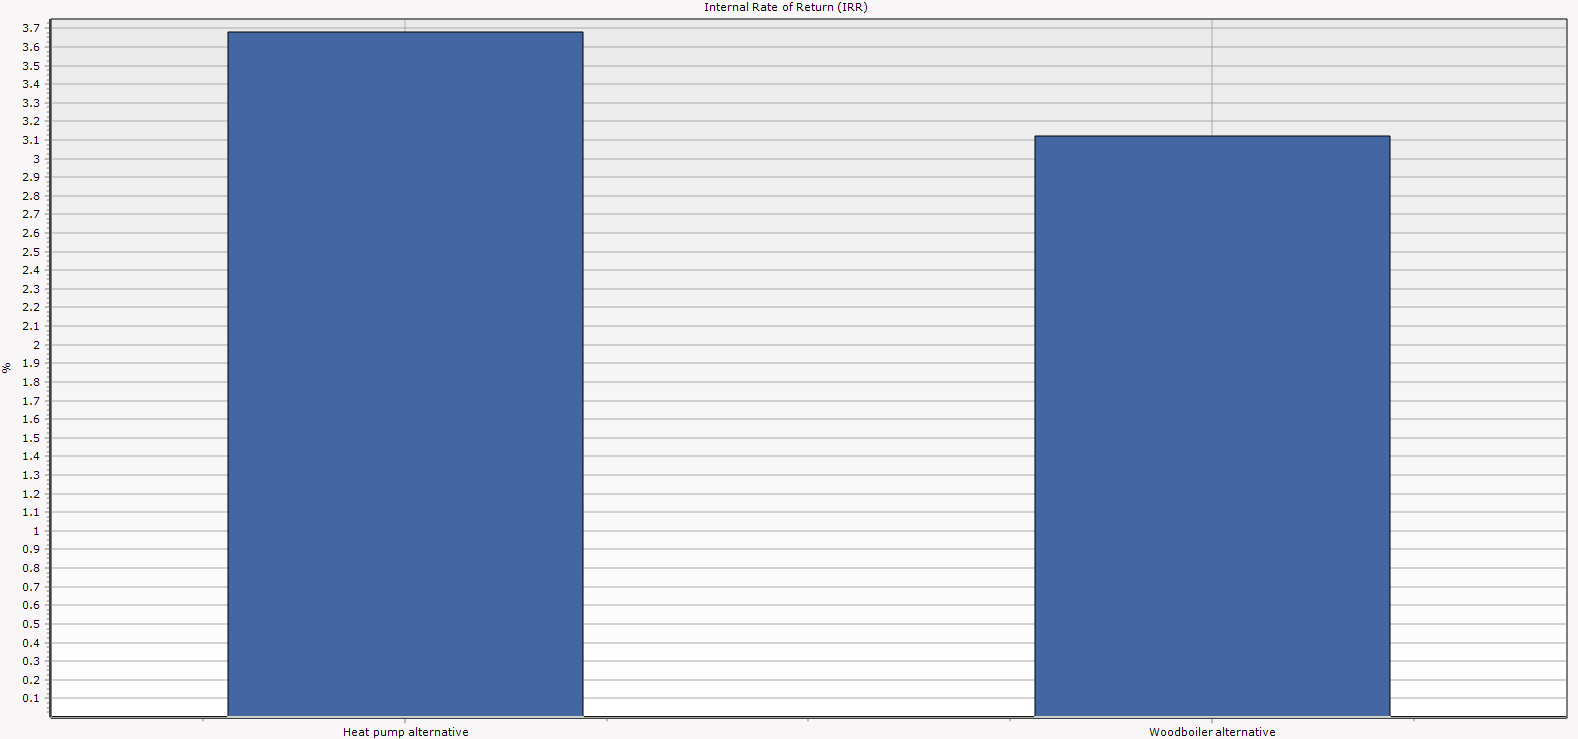
Internal Rate of Return, graphic
The last appendix to the "Compare key financial figures" is the "Internal Rate of Return, graphic".
Environment
The Compare "Environment" report is available when having a COMPARE license and your project contains one or more alternatives.
Pie and bar chart
The pie and bar chart presents monthly or yearly values in either a pie or a bar chart.
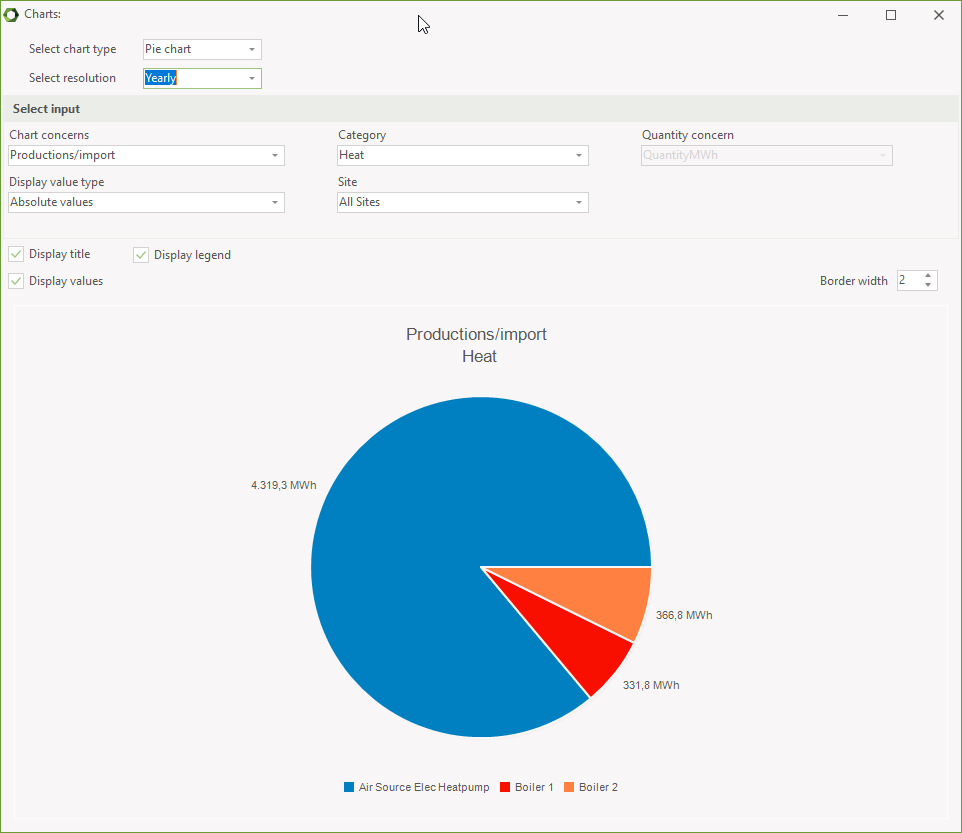
You start by selecting between Pie or Bar chart. Next, the resolution, Monthly or Yearly.
Chart concerns can either be Productions/import or Demands/consumptions
Category is a list of energy types in the project, heat, electricity, process heat, cooling, the different fuels.
The values can either be displayed as values, percentage, just label or label with value or labet with percentage.
In case of more sites, you can select between the different sites. Likewise, if having more alternatives.
Finally, you can decide if you want to display title, legend and values.
Calculation log
The Calculation log shows some meta data on the latest calculation. It includes calculation time and pre- and postprocessing for each optimization period.
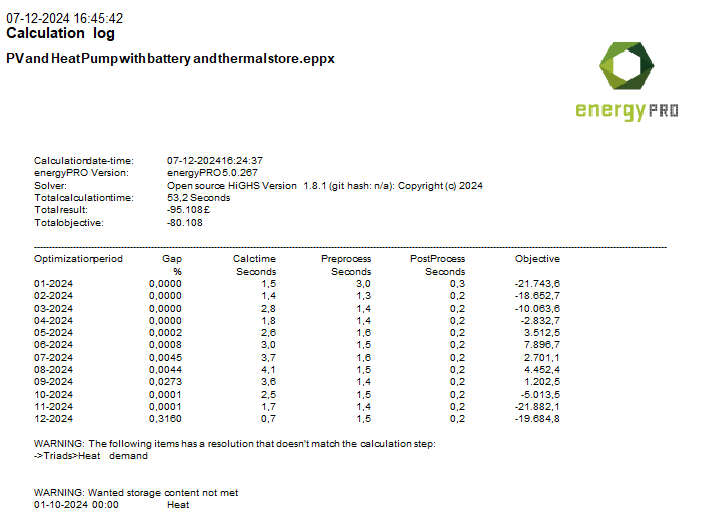
At the bottom is listed warnings.
Project Reports
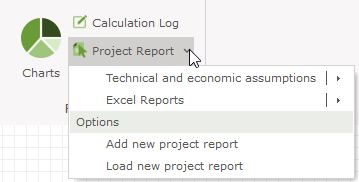
On the Reports tab, you find the Project reports under Report Tools. Here, you can access two project reports and you have the option of adding or loading a project report.
A project report is a collection of other reports. The idea is that the user can select a number of reports to be printed in a single report which makes it easier for the user to produce a full report for the project.
The project reports are stored in the project and can be saved to a file and then imported in other projects.
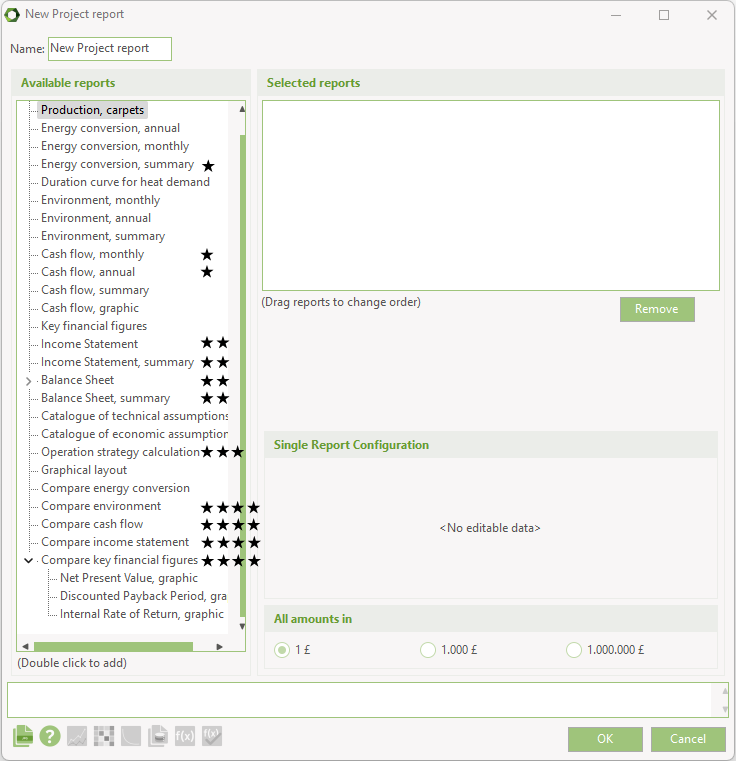
To add a new project report you select “Add new project report”. You can give the project report a name to easily identify it later. Once you have added the project report you can edit it to select the individual reports you want to be included.
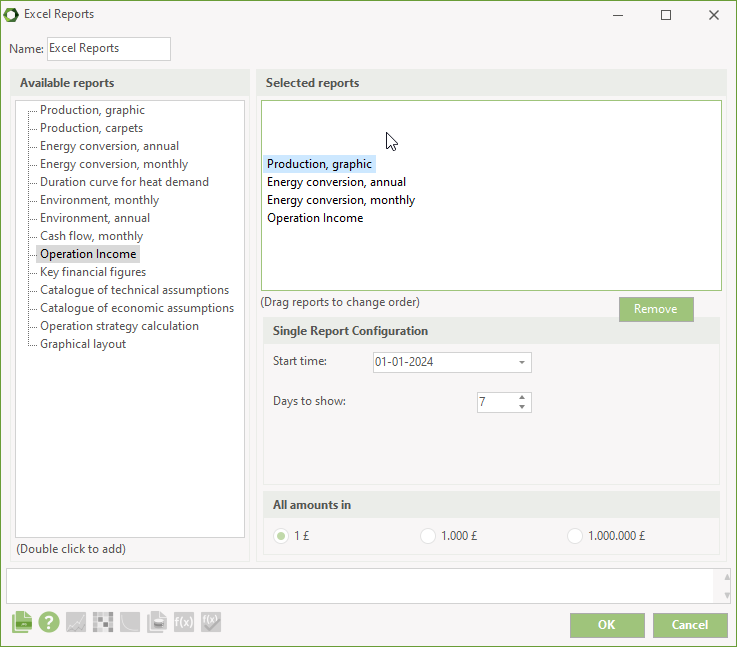
You see the project report edit window which lets the user add individual reports to the project report. On the left hand side all the available reports are shown and on the right hand side the actual reports in the project report are shown. To add reports to the project report you simply Double-click the item on the left hand side. Once the report is added you can configure how the report should look in the final project report.
The example shows a project report containing 4 individual reports:
- Production, graphic
- This type of report requires that the user selects the period to show in the report, which in this case is 7 days starting at 01-01-2024
- Energy conversion, annual
- This type of report needs no further configuration
- Energy conversion, monthly
- This type of report needs no further configuration
- Operation income
- As this is an economy report it requires the user to select the payment lines to show and it will be generated using the select currency in “All amount in”
Once a project report is added it will be available as an item under Project report in the Report Tools group. When the project report is viewed the reports in it will be generated in the order they appear in the edit window.
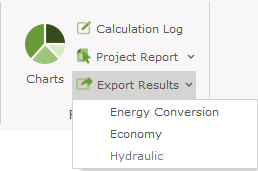
Export Results
At present up to three items are available. The first is a tool for exporting energy calculation to the clipboard. The Tools menu is shown below.
Export energy conversion setup
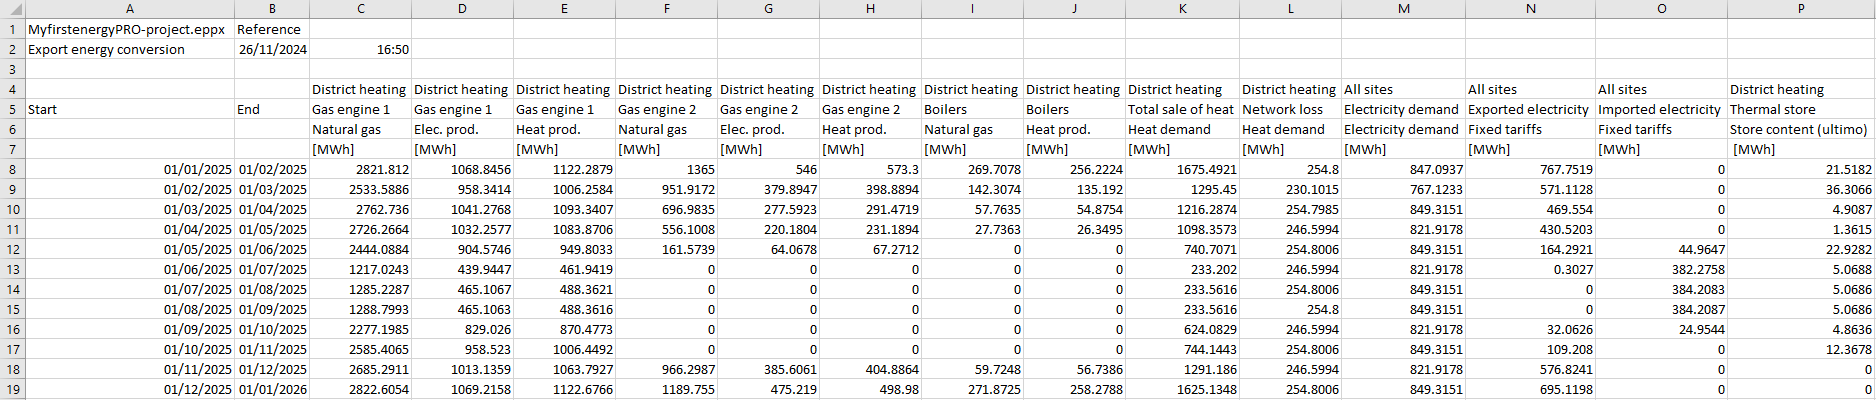
By choosing “Export results” and ”Energy conversion” in the "Reports" menu, it is possible to copy data from the energy conversion results of a project to the clipboard, and then pasting the results into a spread sheet. The destination can also be a csv-file.
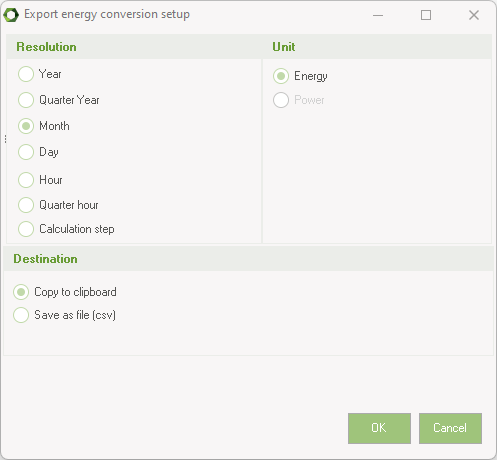
You can choose between a number of resolutions. If the selected resolution is below the hour, the values can be in energy or power.
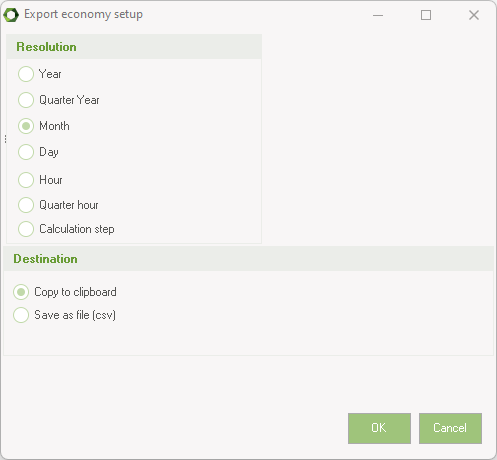
Export Economy
By choosing “Export results” and ”Economy” in the "Reports" menu, it is possible to copy data from the operation income results of a project to the clipboard, and then pasting the results into a spread sheet.
You can select the resolution and the destination.
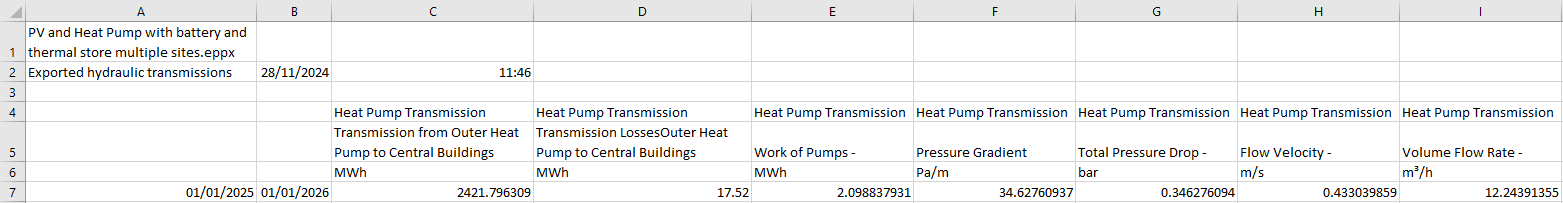
Export Hydraulics
By choosing “Export results” and ”Hydraulic” in the "Reports" menu, it is possible to copy data from the operation income results of a project to the clipboard, and then pasting the results into a spread sheet.
You can select the resolution and the destination.